




Pump Digital Twin
See what is happening inside a pump—and what could happen next. Explore equipment in 3D, follow an anomaly to its possible cause, and compare responses before making a real-world change. Five clear steps turn equipment data into an experience built for decision-makers.
 React
React TypeScript
 Python
 AWS
AWS
About the project
The challenge: Equipment dashboards can show plenty of measurements without making the situation clear. For a decision-maker, the important questions are simpler: What needs attention? What might be causing it? Which response could improve the outcome?
The product: Pump Digital Twin connects those questions in one guided experience. An interactive pump model brings components and operating signals together, while a five-step journey leads users from monitoring to investigation, simulation, and comparison.
The approach: AWS TwinMaker connects the 3D scene with equipment data. AWS Lambda runs the pump simulation and analysis logic, and Amazon SageMaker supports anomaly assessment. A React and TypeScript interface makes the results accessible through component highlights, readable charts, and side-by-side comparisons.
The demonstration: The demo uses synthetic equipment telemetry and isolated incident scenarios. Its illustrative 24-hour histories are anchored to AWS replay outcomes. Users can explore possible causes and model responses without controlling real equipment; simulated outcomes are estimates, not validated failure forecasts.
Built with React, Python, and AWS digital twin services
About the project
The challenge: Equipment dashboards can show plenty of measurements without making the situation clear. For a decision-maker, the important questions are simpler: What needs attention? What might be causing it? Which response could improve the outcome?
The product: Pump Digital Twin connects those questions in one guided experience. An interactive pump model brings components and operating signals together, while a five-step journey leads users from monitoring to investigation, simulation, and comparison.
The approach: AWS TwinMaker connects the 3D scene with equipment data. AWS Lambda runs the pump simulation and analysis logic, and Amazon SageMaker supports anomaly assessment. A React and TypeScript interface makes the results accessible through component highlights, readable charts, and side-by-side comparisons.
The demonstration: The demo uses synthetic equipment telemetry and isolated incident scenarios. Its illustrative 24-hour histories are anchored to AWS replay outcomes. Users can explore possible causes and model responses without controlling real equipment; simulated outcomes are estimates, not validated failure forecasts.
Built with React, Python, and AWS digital twin services
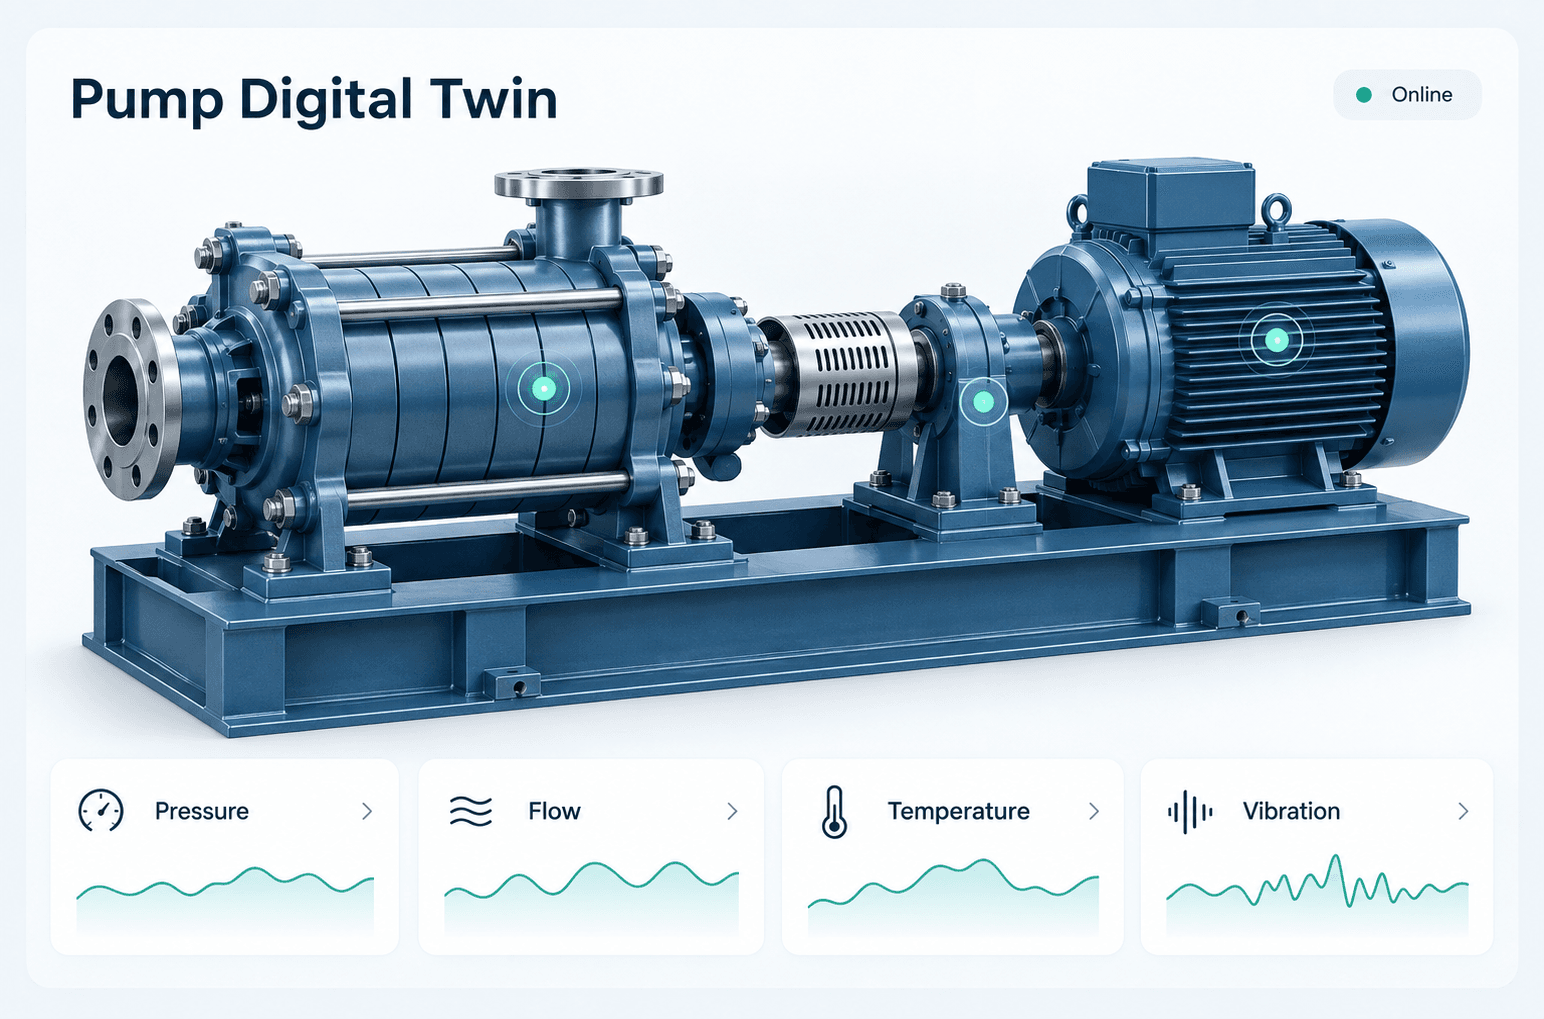
From a signal to a clearer decision
Explore the pump. Understand an incident. Test a response. See how a digital twin turns equipment data into a guided decision-making experience.
ReactTypeScriptPythonAWSFrom a signal to a clearer decision
Explore the pump. Understand an incident. Test a response. See how a digital twin turns equipment data into a guided decision-making experience.
ReactTypeScriptPythonAWS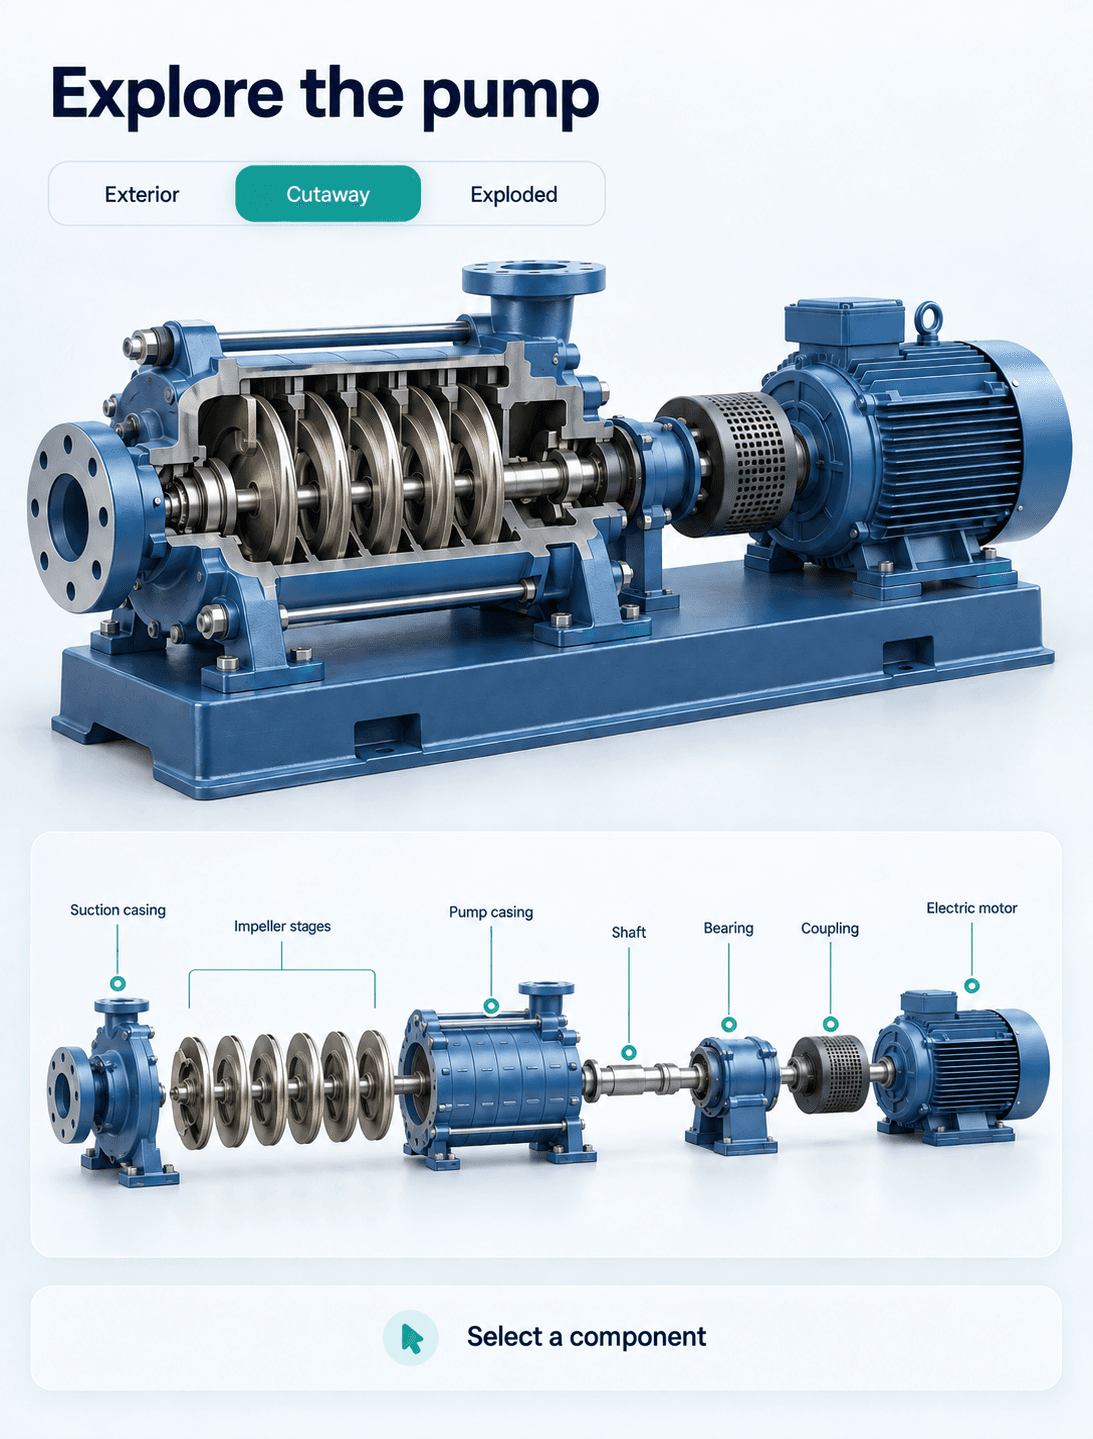
Features
See the equipment. Find the signal.
Rotate the pump, look inside with the cutaway view, or separate its components in an exploded view. Select a measurement or a component to bring the relevant part into focus. Animated moving parts make the relationship between the motor, shaft, and impeller stages easier to understand.
Pressure, flow, bearing temperature, and vibration sit alongside the model. When an incident appears, component colors and readable status labels show where attention is needed. Users get a clear starting point for investigation without navigating an engineering dashboard.
Follow an anomaly to its possible cause
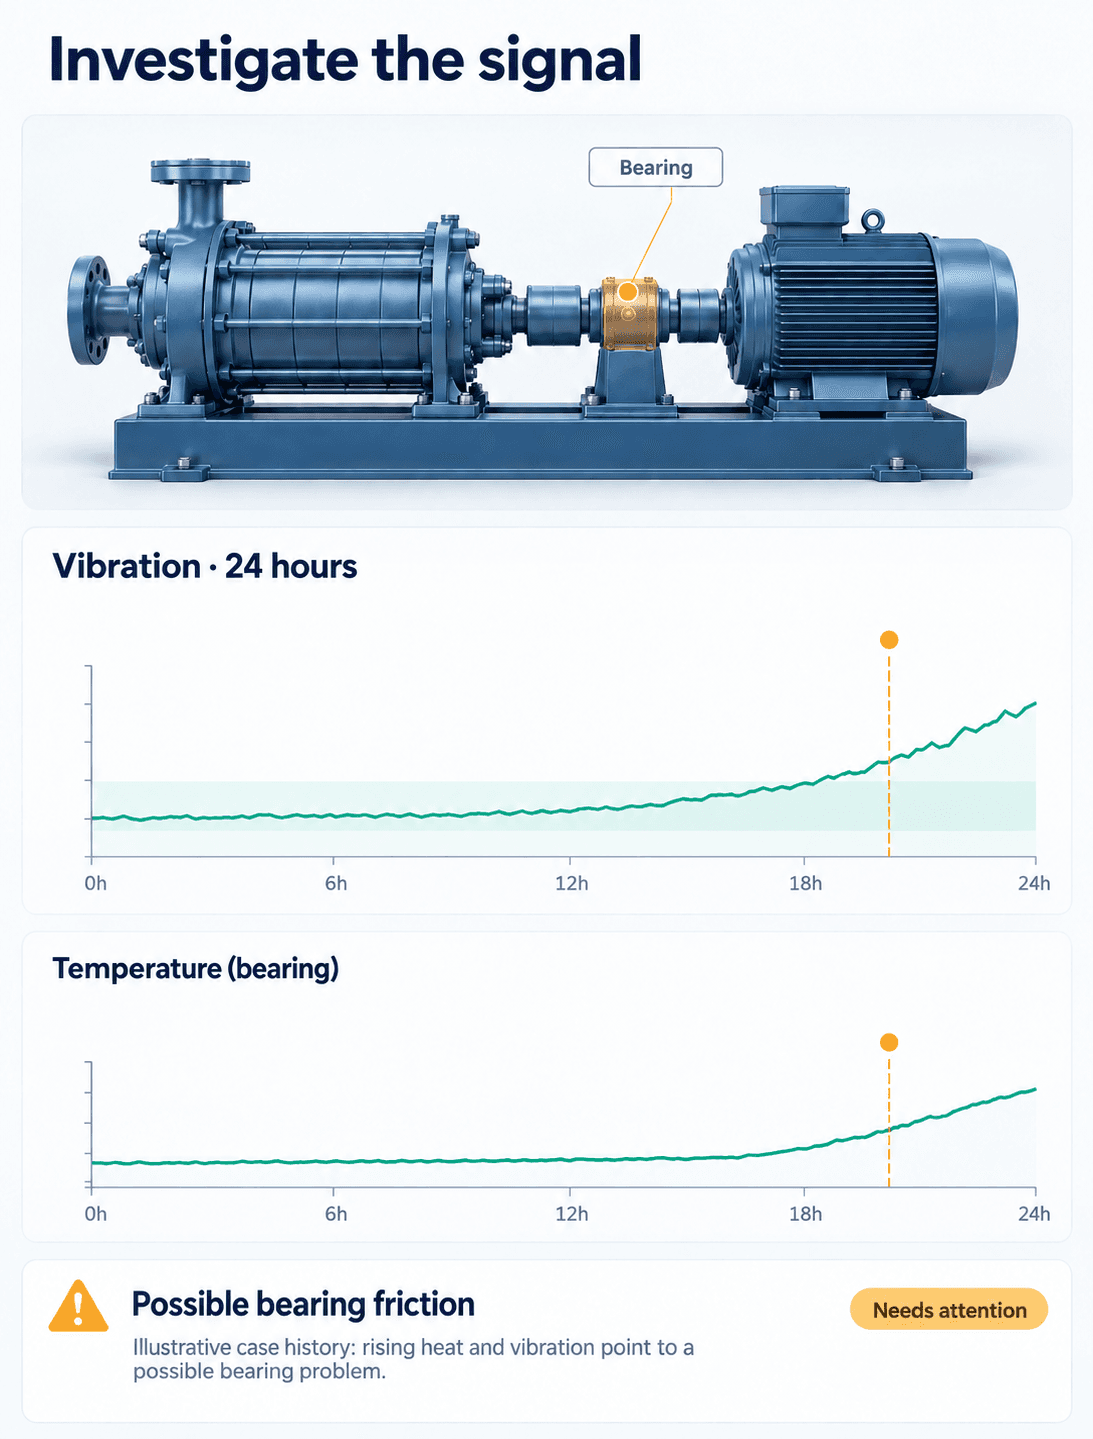
Each new demonstration can introduce a different incident, such as suction instability, bearing friction, a discharge restriction, or a sensor dropout. The selected case stays consistent throughout the investigation, so the signals, explanation, and later comparison tell the same story.
An illustrative 24-hour timeline helps users explore how the case develops and compare related measurements. Plain-language explanations connect the signals with a possible cause and a response worth exploring. Missing readings remain visible as gaps, and possible causes are presented as hypotheses to investigate.
Test a response. Compare the outcome.
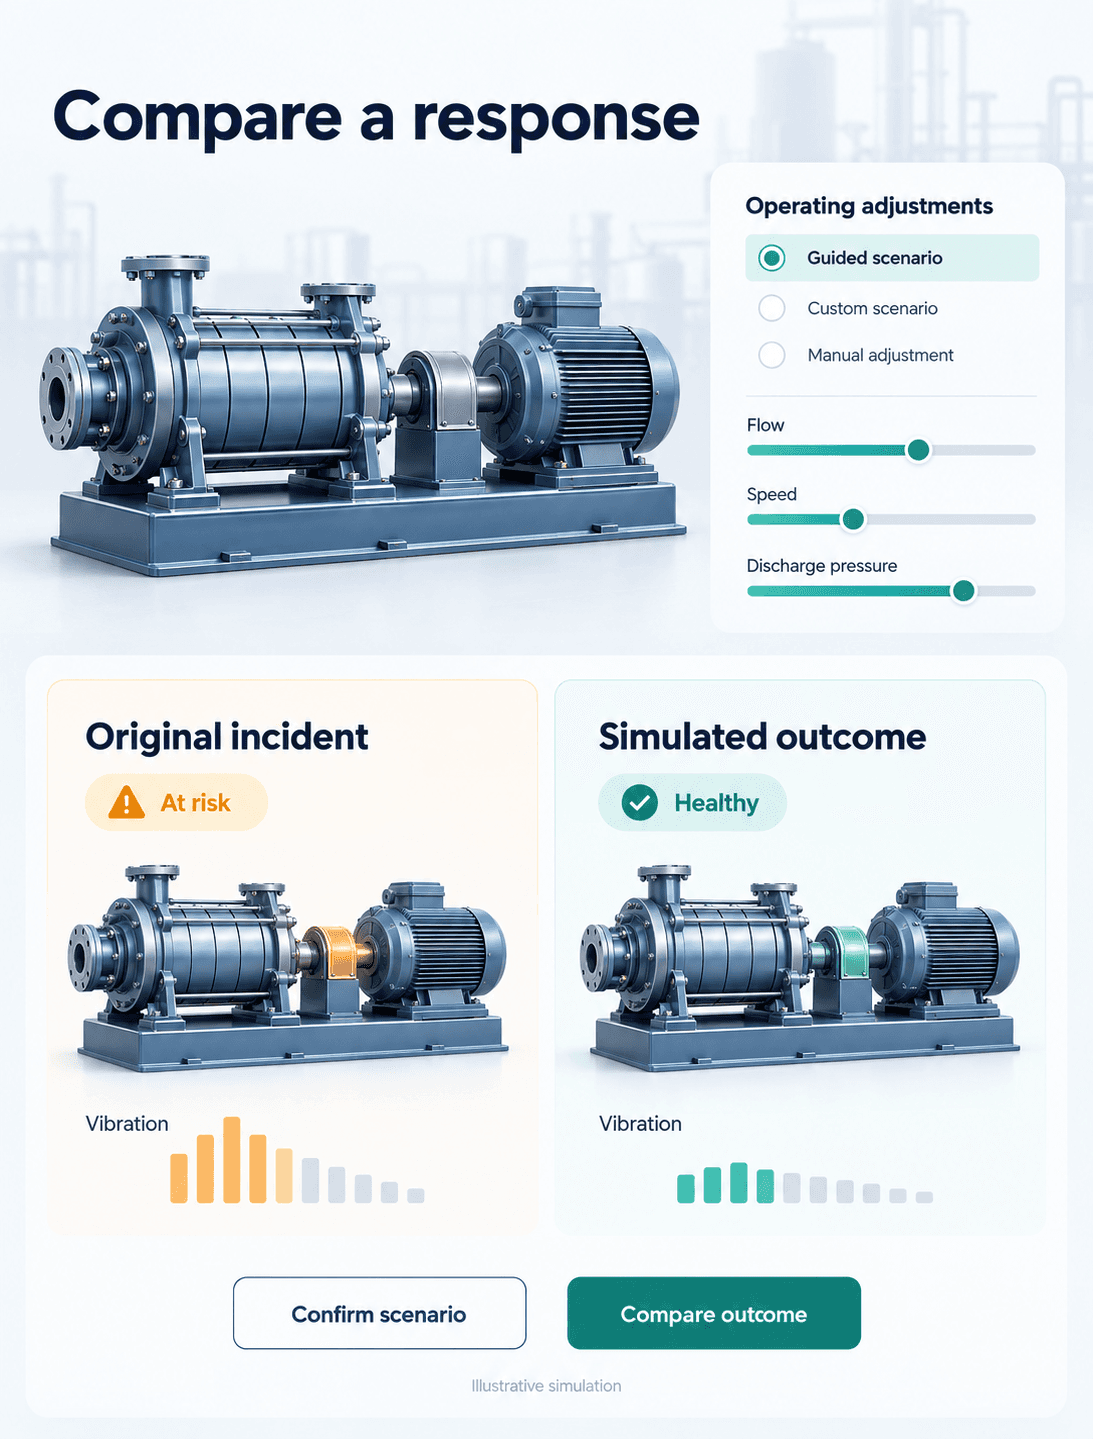
Choose a guided scenario or adjust operating conditions in a custom what-if experiment. AWS calculates the simulated outcome, and the interface shows how the estimated condition and key measurements change. Users review the result and confirm the scenario before moving to comparison.
The final step places the original incident and the simulated response side by side. It makes the effect of an adjustment easier to discuss, without changing the monitored pump. Users can return to the simulation, try another response, and compare it against the same starting point.
Features
See the equipment. Find the signal.
Rotate the pump, look inside with the cutaway view, or separate its components in an exploded view. Select a measurement or a component to bring the relevant part into focus. Animated moving parts make the relationship between the motor, shaft, and impeller stages easier to understand.
Pressure, flow, bearing temperature, and vibration sit alongside the model. When an incident appears, component colors and readable status labels show where attention is needed. Users get a clear starting point for investigation without navigating an engineering dashboard.
Follow an anomaly to its possible cause
Each new demonstration can introduce a different incident, such as suction instability, bearing friction, a discharge restriction, or a sensor dropout. The selected case stays consistent throughout the investigation, so the signals, explanation, and later comparison tell the same story.
An illustrative 24-hour timeline helps users explore how the case develops and compare related measurements. Plain-language explanations connect the signals with a possible cause and a response worth exploring. Missing readings remain visible as gaps, and possible causes are presented as hypotheses to investigate.
Test a response. Compare the outcome.
Choose a guided scenario or adjust operating conditions in a custom what-if experiment. AWS calculates the simulated outcome, and the interface shows how the estimated condition and key measurements change. Users review the result and confirm the scenario before moving to comparison.
The final step places the original incident and the simulated response side by side. It makes the effect of an adjustment easier to discuss, without changing the monitored pump. Users can return to the simulation, try another response, and compare it against the same starting point.
Contact Us






Anastasia Timoshenko
Regional Account Manager
1000+
Delivered projects
300+
Clients worldwide
700+
In-house developers
28+
Years in industry


 5.0 Ratings